The corridor data table
Asking medians for every parish in the corridor with week-over-week change, sample sizes inline, and rental context underneath. The foundation of every issue.
Every Tuesday at 10:00 Lisbon time. 12 parishes, 90+ market zones, raw data — no speculation, no net-yield guesswork, no buyer-specific math.
Asking medians for every parish in the corridor with week-over-week change, sample sizes inline, and rental context underneath. The foundation of every issue.
What this corridor is asking against what INE says actually transacted last quarter. The gap, parish by parish, calculated and disclosed each week.
Every issue ships one listing with everything: price, area, €/m², parish-typology comp with sample size, gross-yield estimate (clearly labeled), drop history, listing link.
Cascais asking medians moved another −1.7% WoW. The interesting story is not the headline number — it's where the corridor diverges from what INE says actually transacted last quarter. Lapa parish is asking +47.5% above its most recent INE realized-price print. Estoril is closer to +18%. The gap mostly reflects how far asking has run relative to last year's closes, not against deals being signed this month.
Raw data only. Gross yields are estimates — never net. We don't calculate acquisition costs, tax, management fees, or operating assumptions because we don't know your residency status or entity structure. That's your math, not ours. Every figure in a deal card carries a sample size so you know what you're reading. Sources: Idealista, Imovirtual, Casa Sapo, and INE quarterly. That's it.
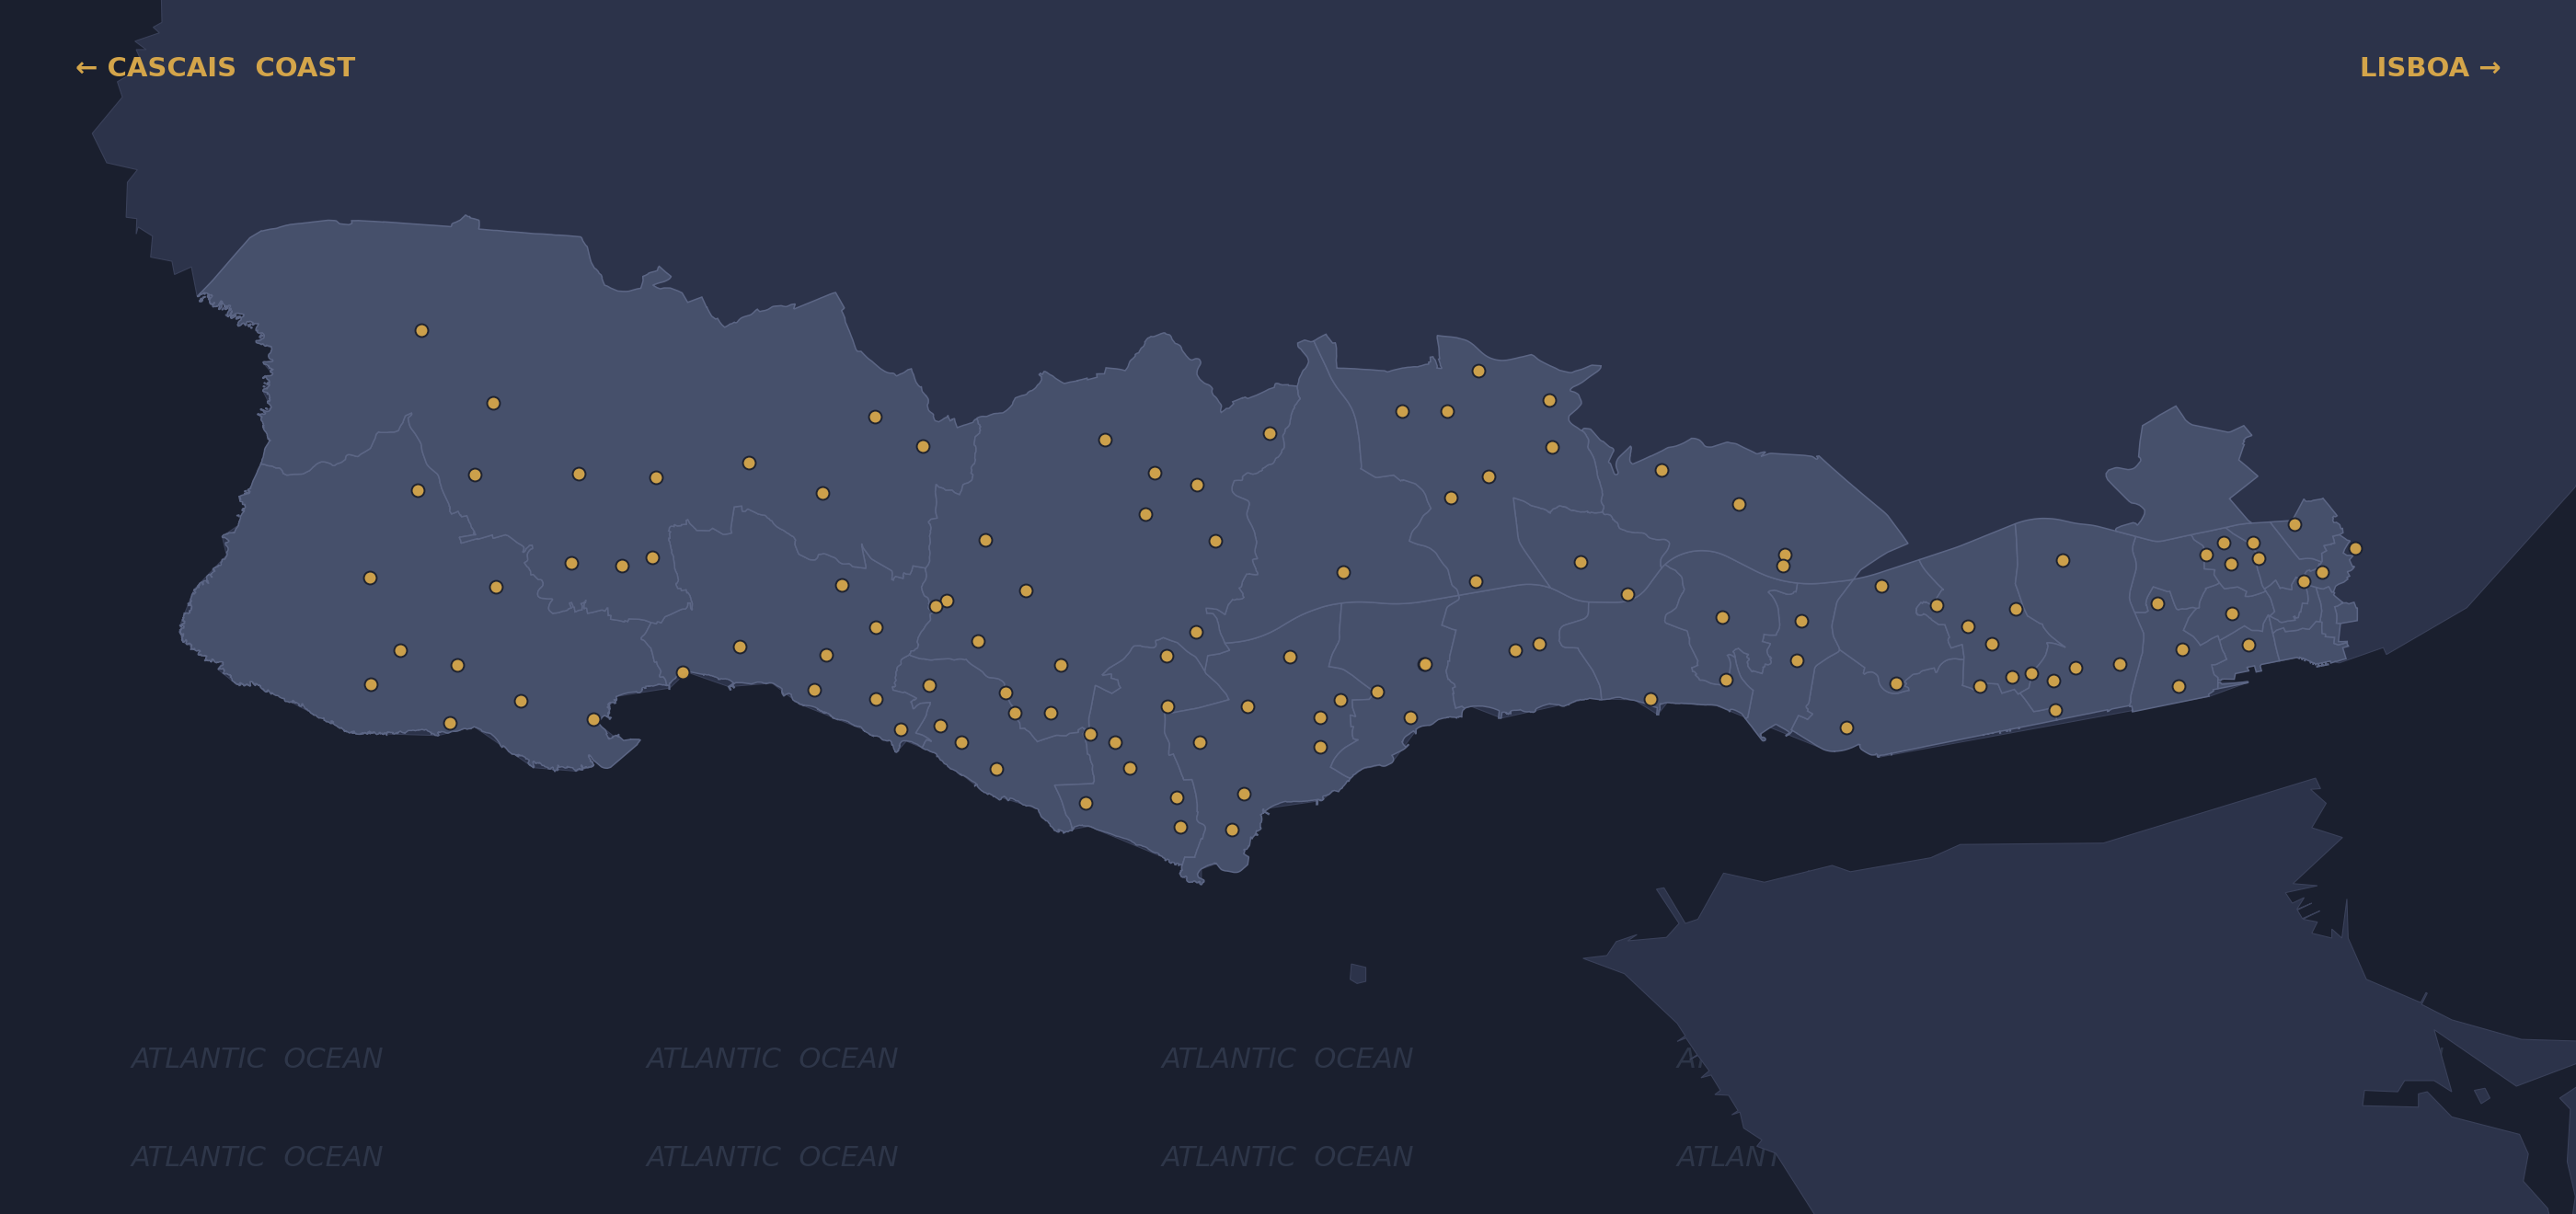
Cascais, Oeiras, and west Lisboa — the Atlantic coastal corridor. The parishes we cover are the ones investors actually shop in. Nothing further inland, nothing further south.